Understanding the Impact of Social Determinants of Health on COVID-19 Outbreak
Gargya Malla, MD, MPH
University of Alabama at Birmingham
gmalla@uab.edu
732-407-8599
Venkata Sthanam, MS
University of Alabama at Birmingham
sthanamv@uab.edu
205-234-3860
Ravi Kumar Podapati
University of Alabama at Birmingham
ravikp@uab.edu
270-935-7585
Praneeth Reddy Amudala Puchakayala
University of Alabama at Birmingham
appr01@uab.edu
865-361-3142
Sandeep Bodduluri, PhD
University of Alabama at Birmingham
sbodduluri@uabmc.edu
205-996-0982
Ramaraju Rudraraju, PhD
University of Alabama at Birmingham
rrudraraju@uabmc.edu
205-996-9290
Aims
To characterize social determinants of health (SDOH) at county-level using conventional socioeconomic measures as well as less commonly used county-level population measures.
To identify groups of counties that share common characteristics based on the SDOH indices calculated in the previous aim.
To predict COVID-19 mortality rates separately for county types identified in the above aim.
Findings and Implications
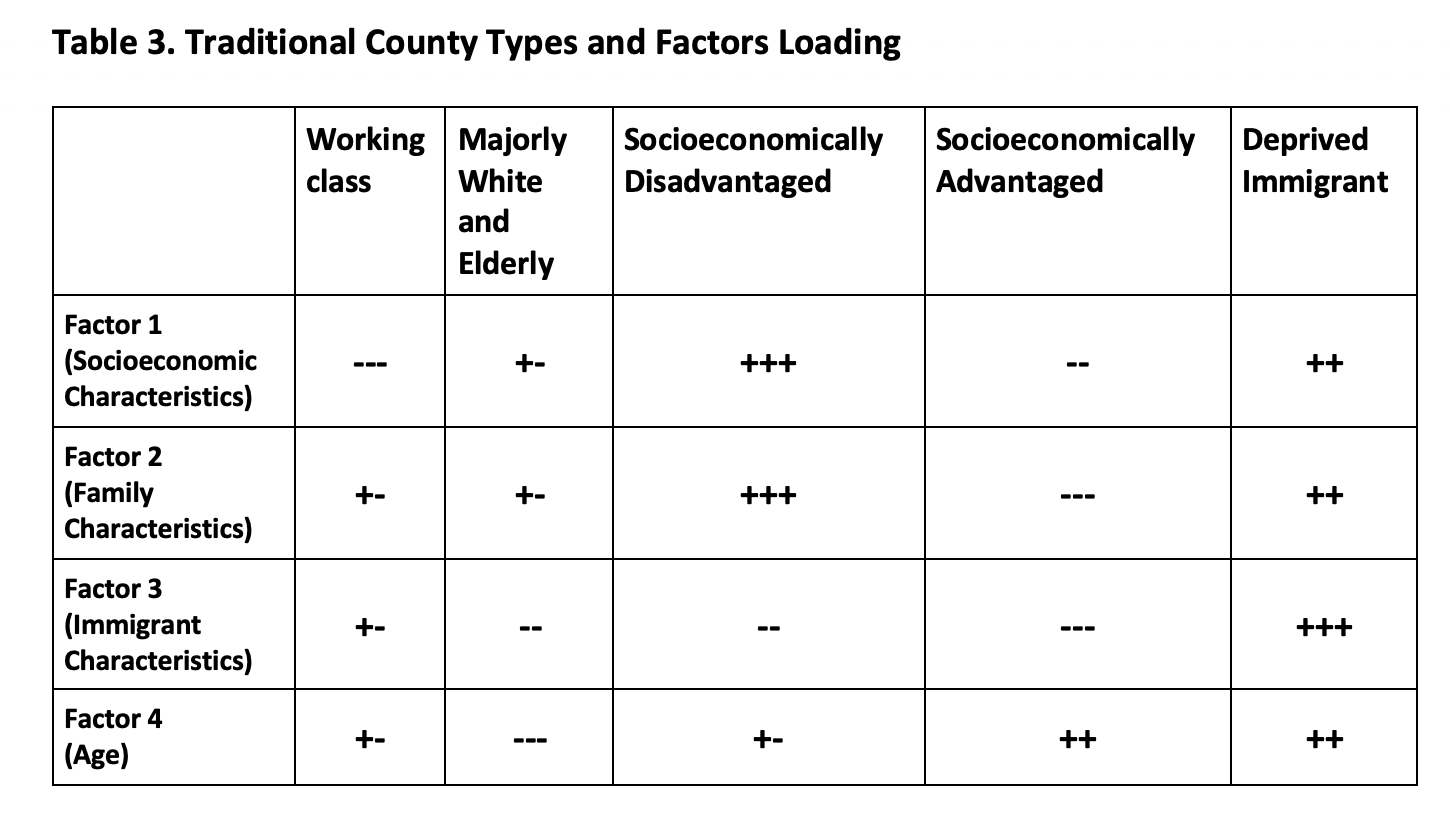
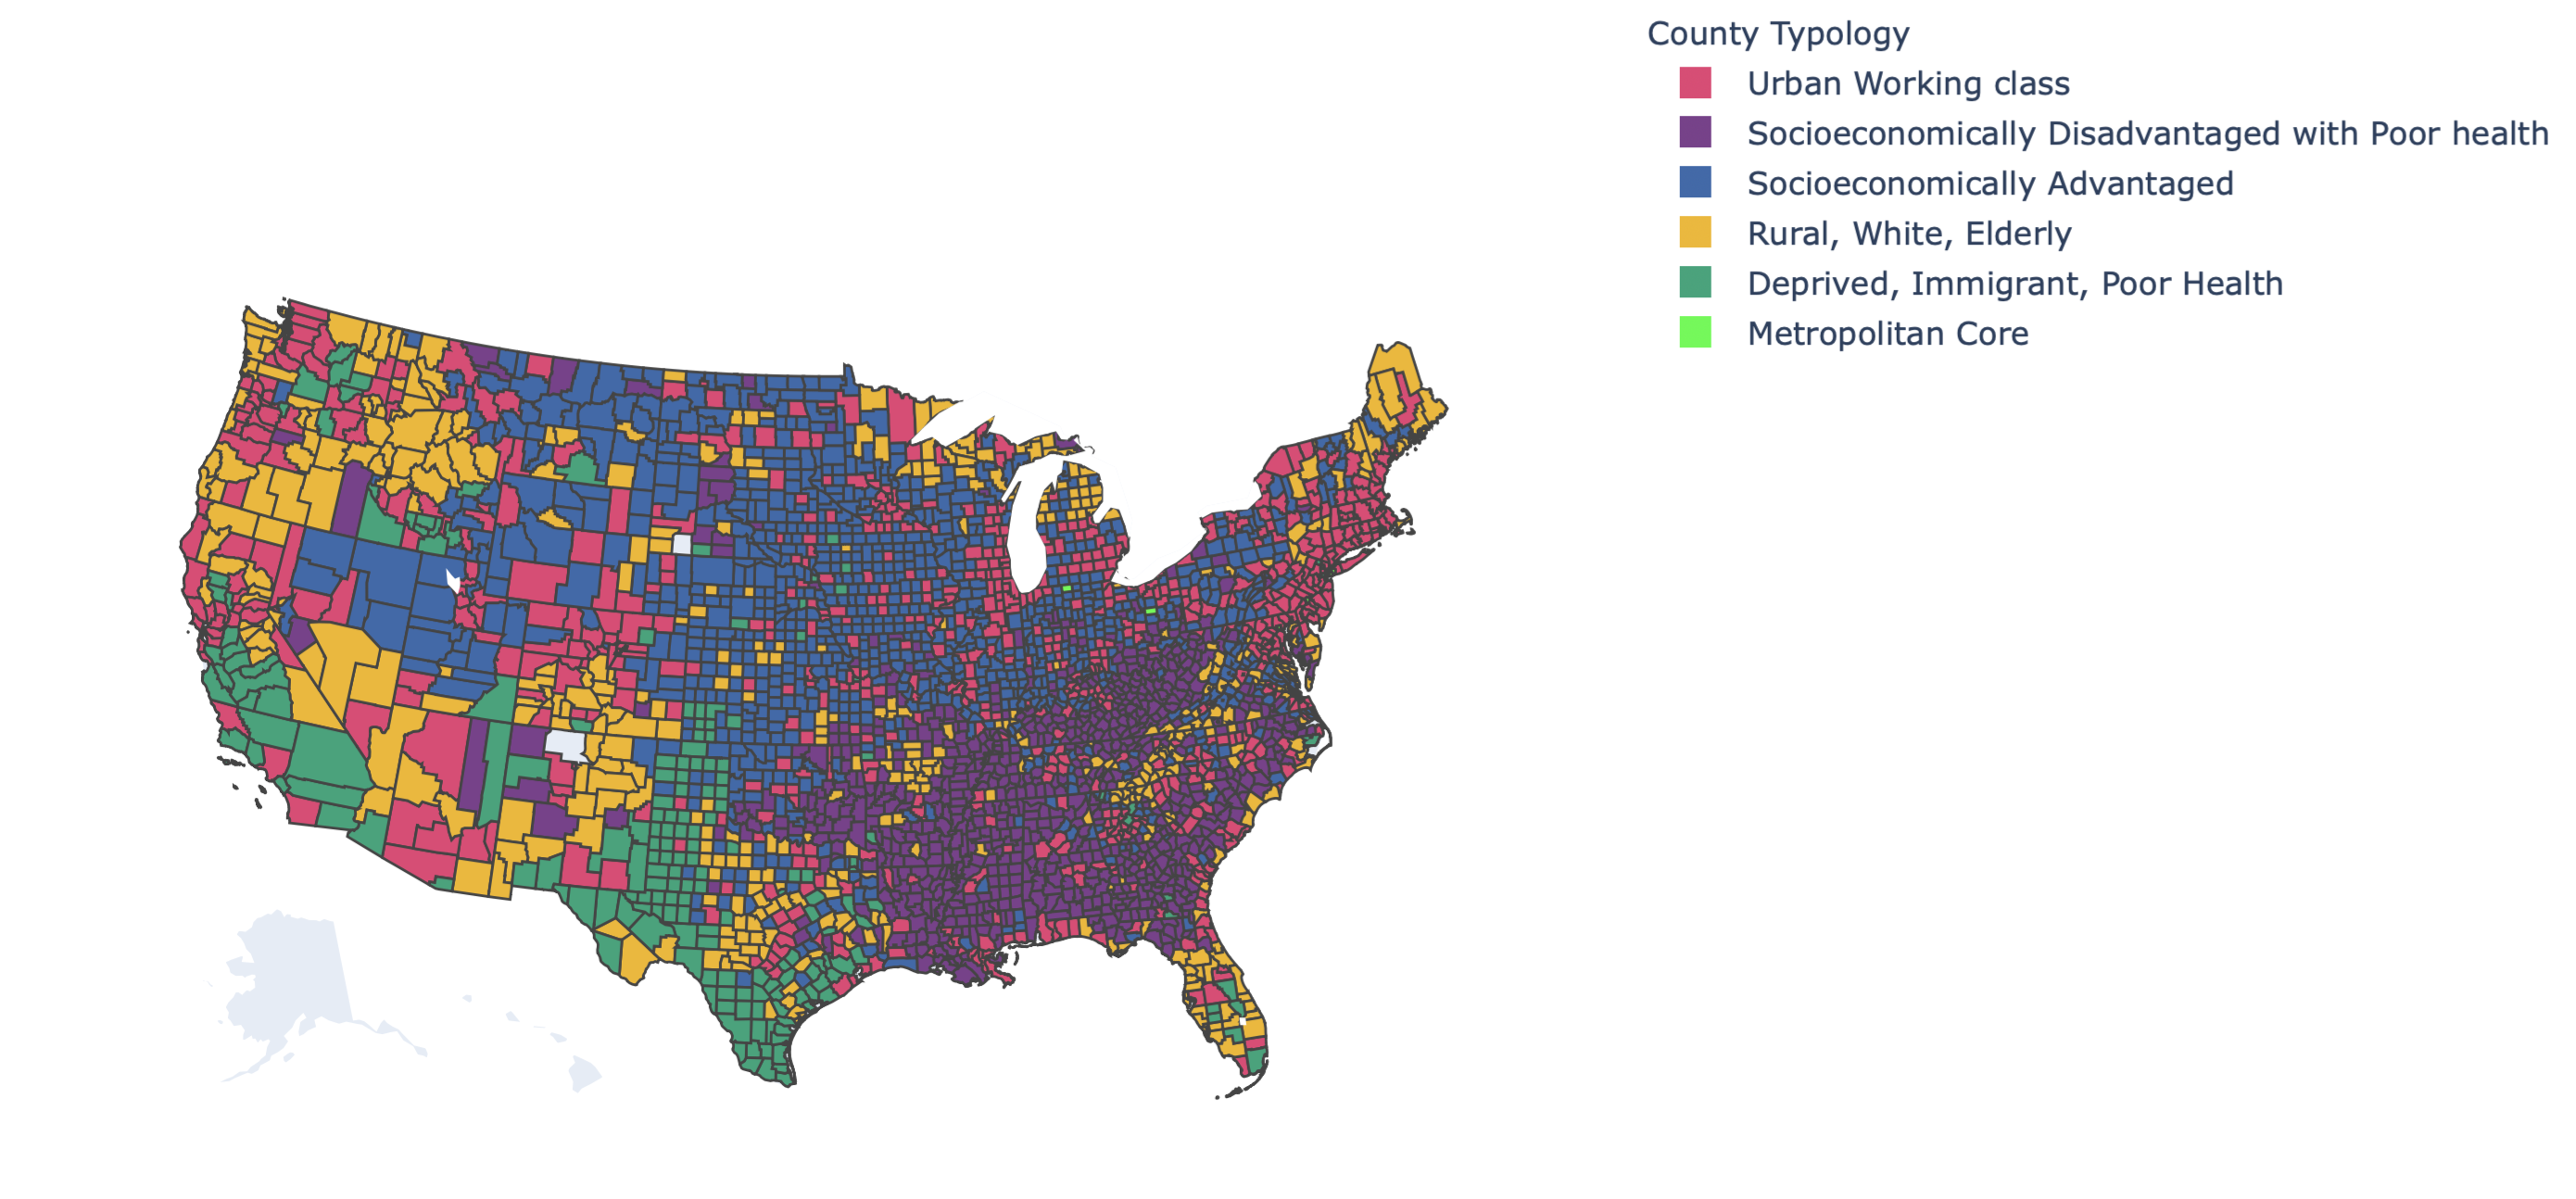
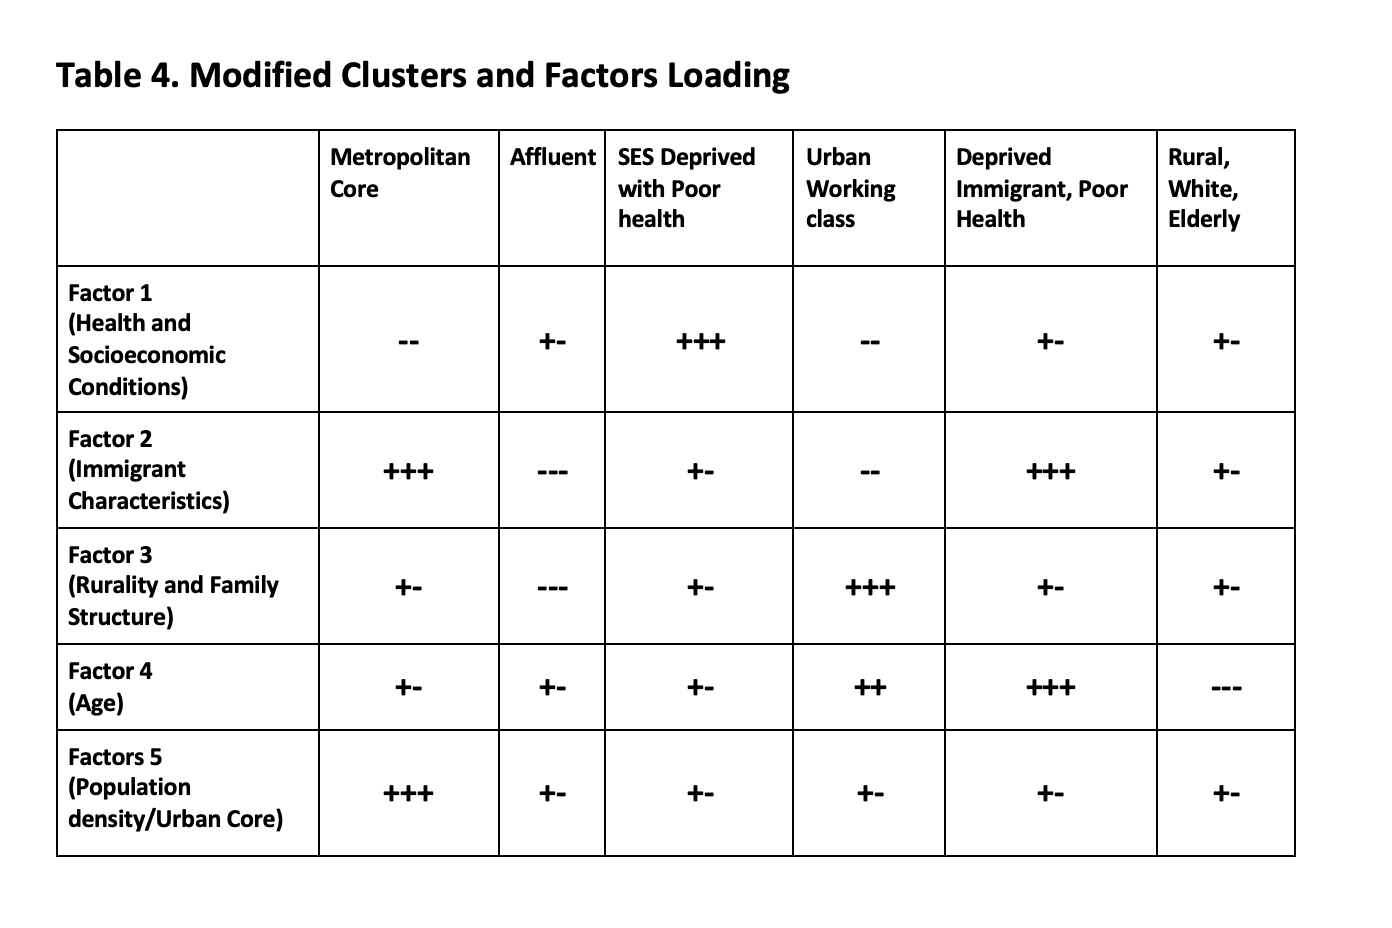
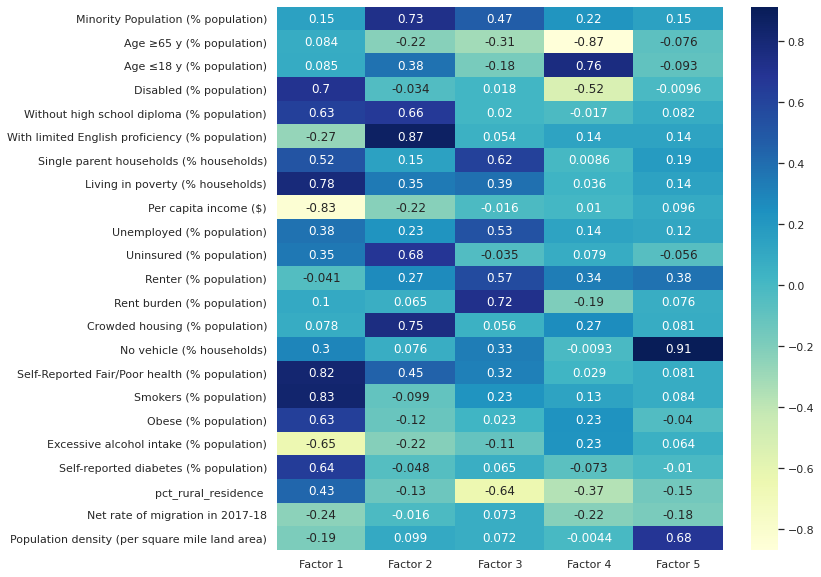
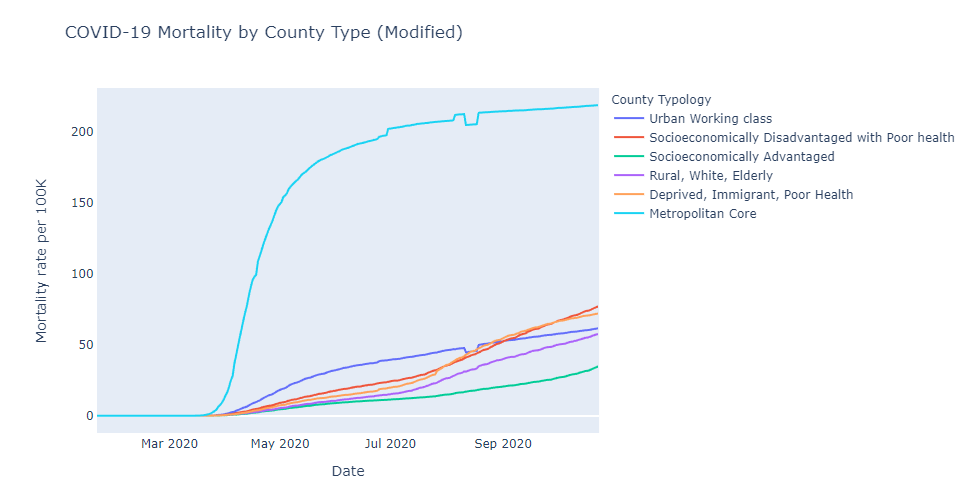
We included 3140 counties of contiguous US for the 23 variables considered in the analysis (Tables 1 & 2). In the exploratory factor analysis using traditional SDOH measures, we identified 4 latent factors explaining 61% variance of the demographic, economic, housing, and social features of the county population (Table 3). In the factors analysis exploring additional county-level features like population density, migration, health, and rurality, we identified 5 latents factors explaining 60.6% (Table 4). While exploring, we observed that economic features, chronic disease burden, and prevalence of health behaviors loaded heavily on the same factor. Using unsupervised clustering methods on the latent factors, we identified distinct groups of counties (Figures 1 & 2)- a) Metropolitan Core b) Socioeconomically Advantaged; Socioeconomically Deprived and poor health c) Urban Affluent and Working Class d) Deprived Immigrant and poor health and f) Rural, White and Elderly. County clusters identified using traditional measures (Figure 1 & Table 3) although similar to clusters identified by the additional factors (Figure 2 & Table 4), an important finding is that the socioeconomically deprived counties and counties with a high proportion of immigrant populations reported poor health and had higher prevalence of chronic diseases. Considering COVID-19 mortality, the Metropolitan Core counties had the highest rates early on in the pandemic but stabilized quickly than the rest of the US, and the Socioeconomically Advantaged counties had the lowest rates and had a steady increase (Figures 3 a,b). Current ongoing work using the Facebook Prophet model to forecast COVID mortality rates while adjusting for the SDOH measures will inform local health officials about the impending risk of COVID for the county.
Acknowledgement
Our heartfelt appreciation for the advice and suggestions from Dr. James Kirklin, Dr. April Carson, and Dr. Gabriela Oates from the University of Alabama at Birmingham; and Sai Santosh Bangalore from Nuvizz Inc.
Link to access interactive visualizations generated from this analysis: https://podapati10.github.io/AHA-Hackthon/
Traditional County Typology Features
Figure 1: Traditional County Types


SDOH Variable Loadings For Factors

Latent Factor Distribution by County Types

Modified County Typology Features
Figure 2: Modified County Types

SDOH Variable Loadings For Factors
Latent Factor Distribution by County Types

Figures 3a, 3b: COVID Mortality by Traditional and Modified County Types

Model Simulation

Link to access interactive visualizations: https://podapati10.github.io/AHA-Hackthon/
Supplementary Figures
Traditional
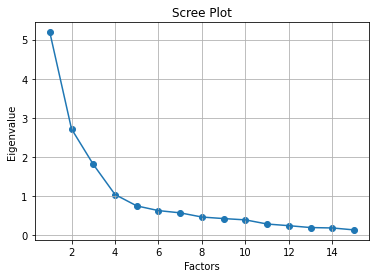
Scree Plot for selecting number of clusters
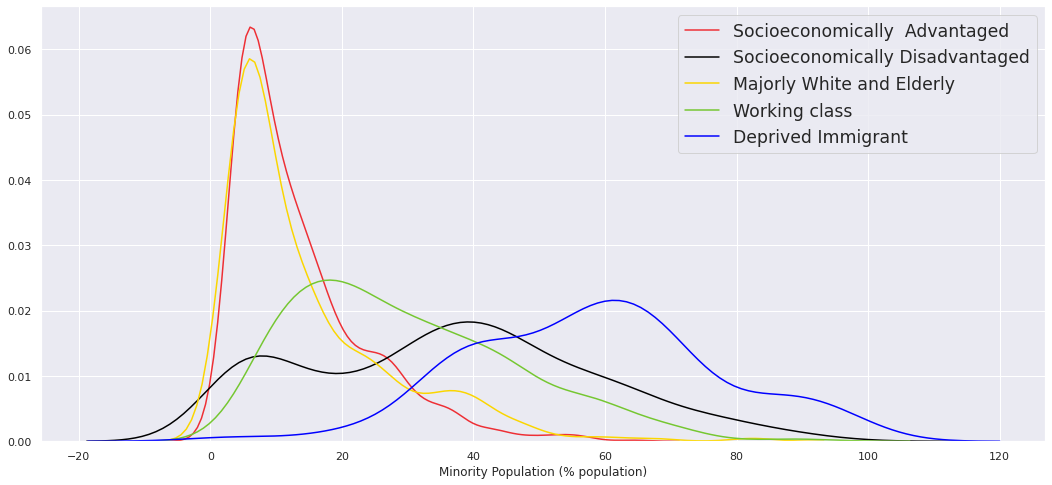
Minority Population (% population) with Typology
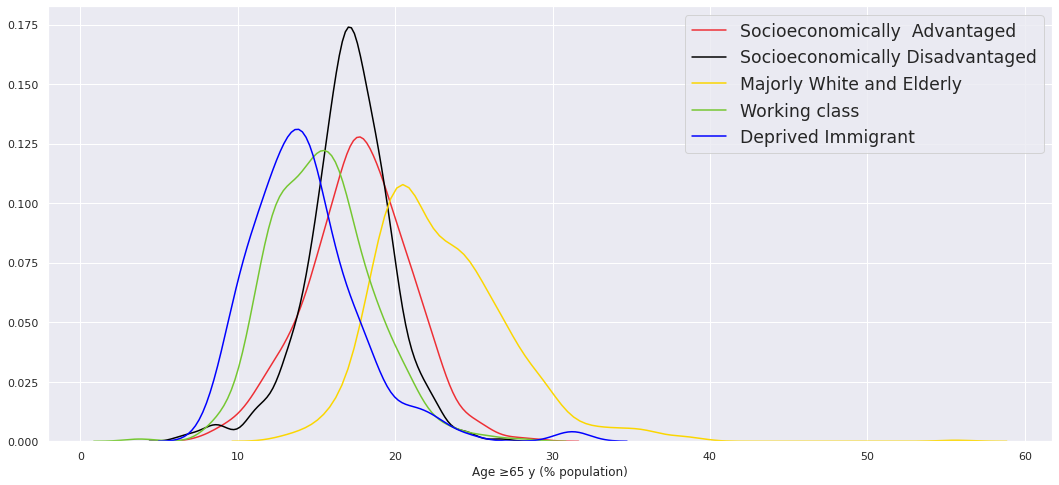
Age ≥65 y (% population) with Typology
Age ≤18 y (% population) with Typology

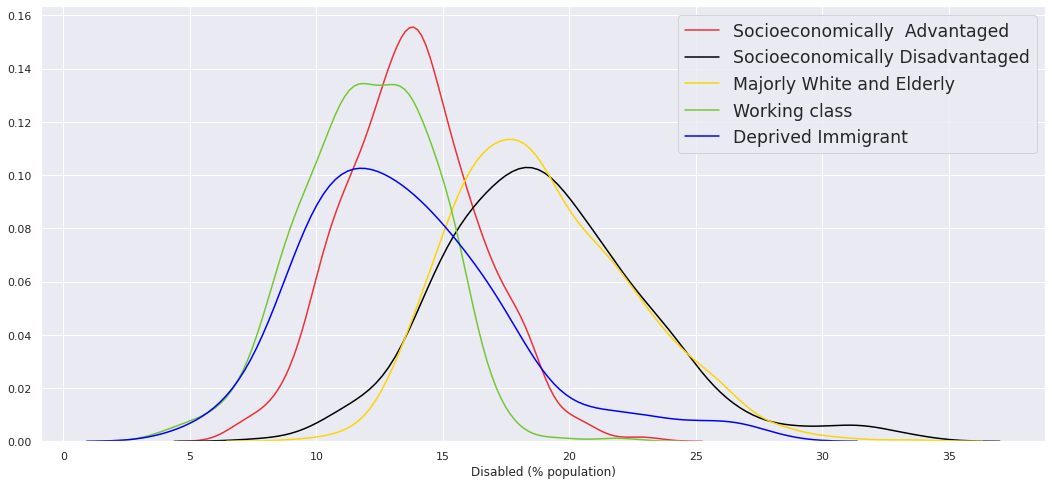
Disabled (% population) with Typology
Without high school diploma (% population) with Typology

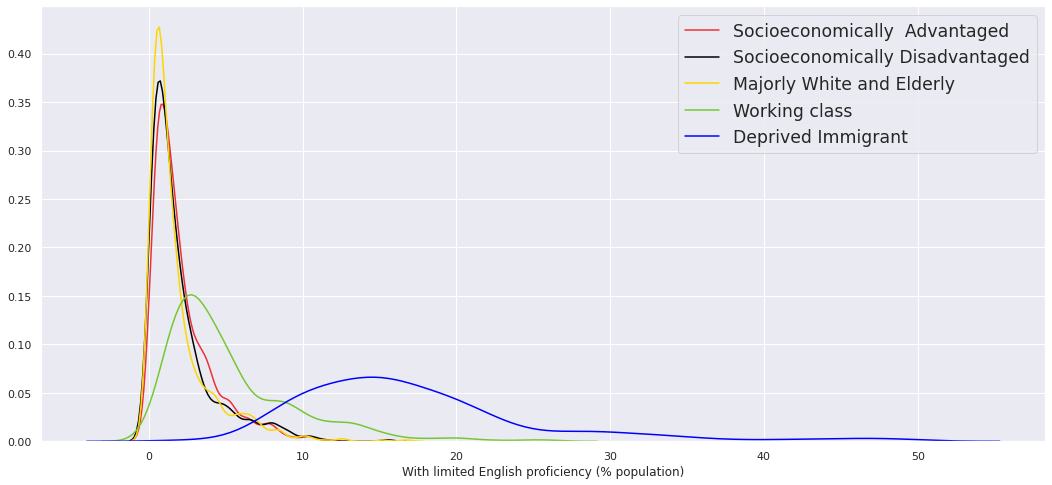
With limited English proficiency (% population) with Typology
Single parent households (% households) with Typology

Living in poverty (% households) with Typology

Per capita income with Typology

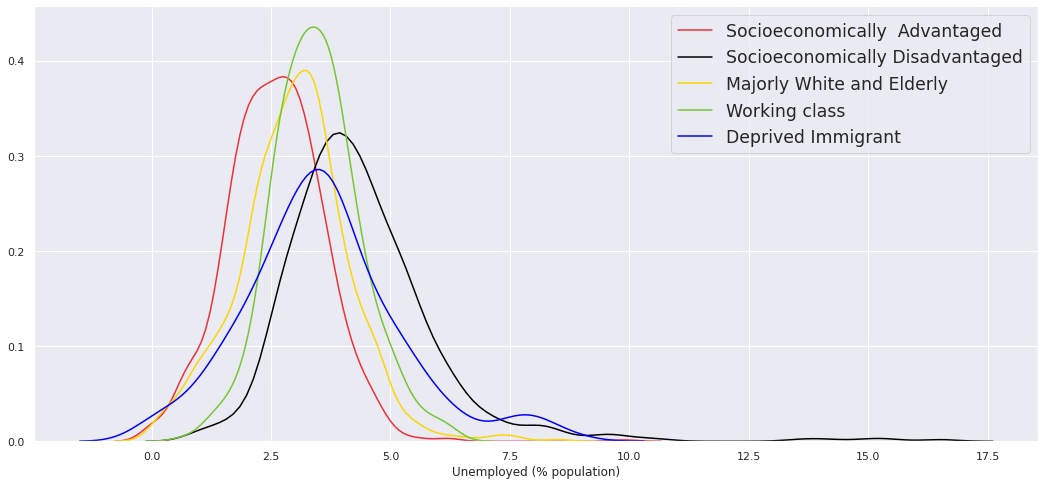
Unemployed (% population) with Typology
Uninsured (% population) with Typology

Renter (% population) with Typology

Rent burden (% population) with Typology

Crowded housing (% population) with Typology

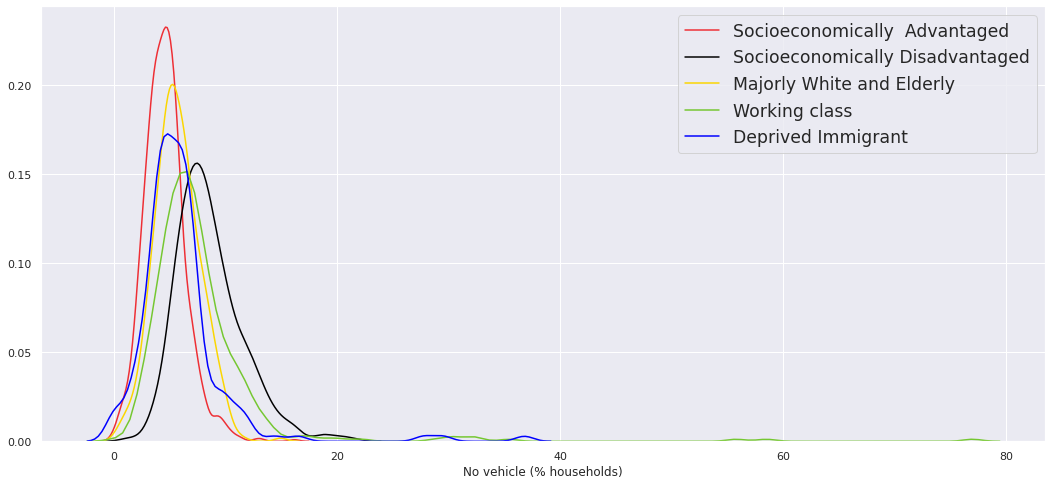
No vehicle (% households) with Typology
Modified
Scree Plot for selecting number of clusters

Minority Population (% population) with Typology

Age ≥65 y (% population) with Typology

Age ≤18 y (% population) with Typology

Disabled (% population) with Typology

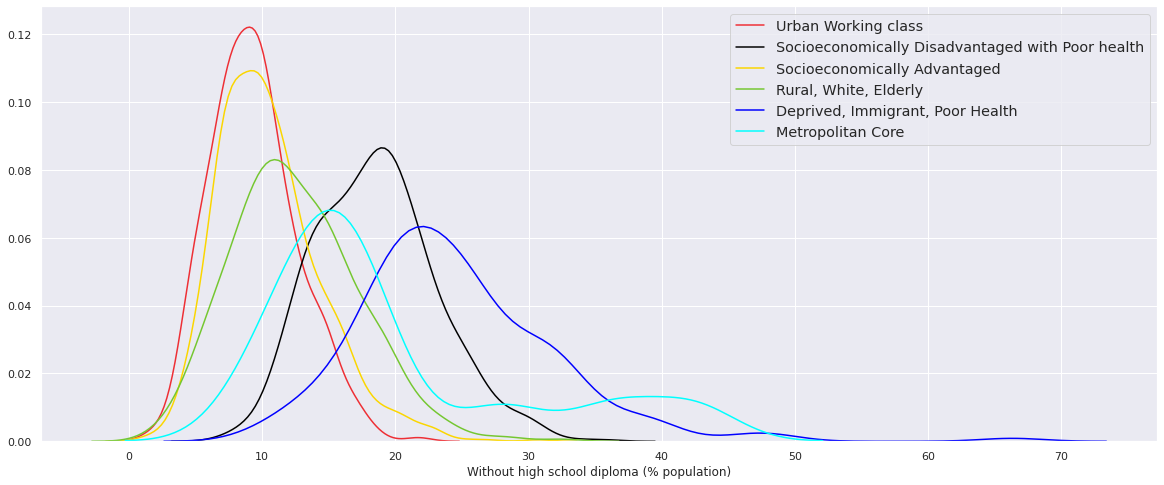
Without high school diploma (% population) with Typology
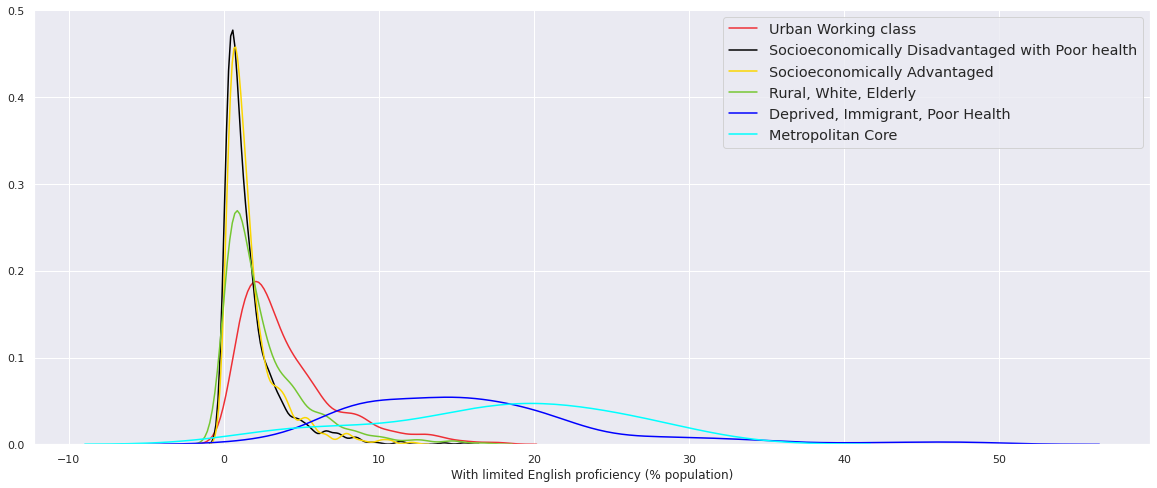
With limited English proficiency (% population) with Typology
Single parent households (% households) with Typology

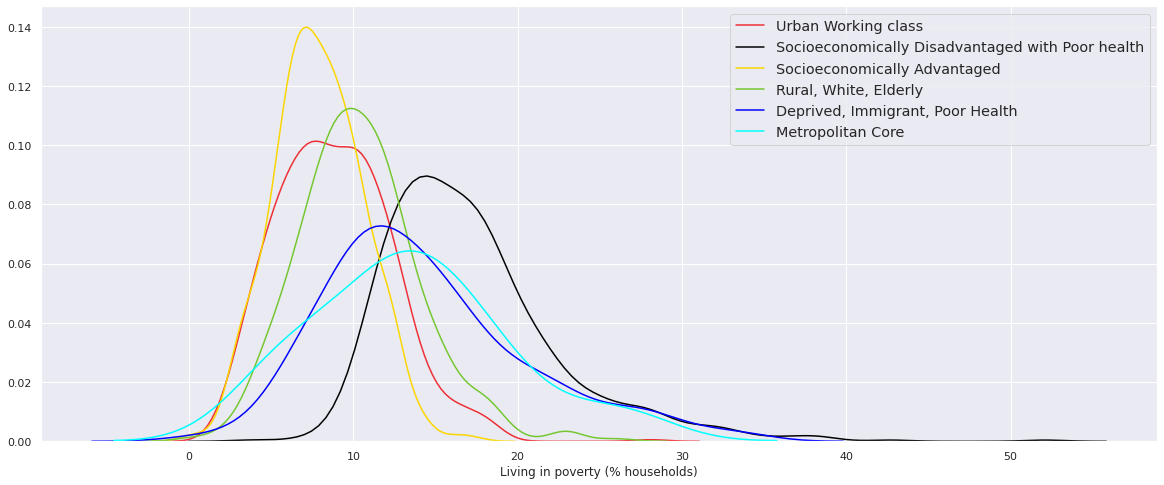
Living in poverty (% households) with Typology
Per capita income with Typology

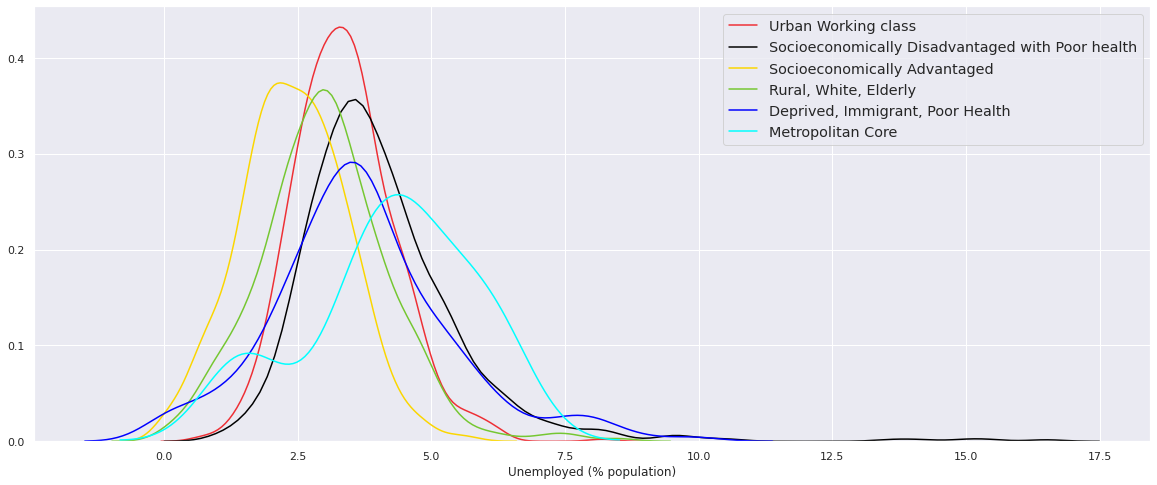
Unemployed (% population) with Typology
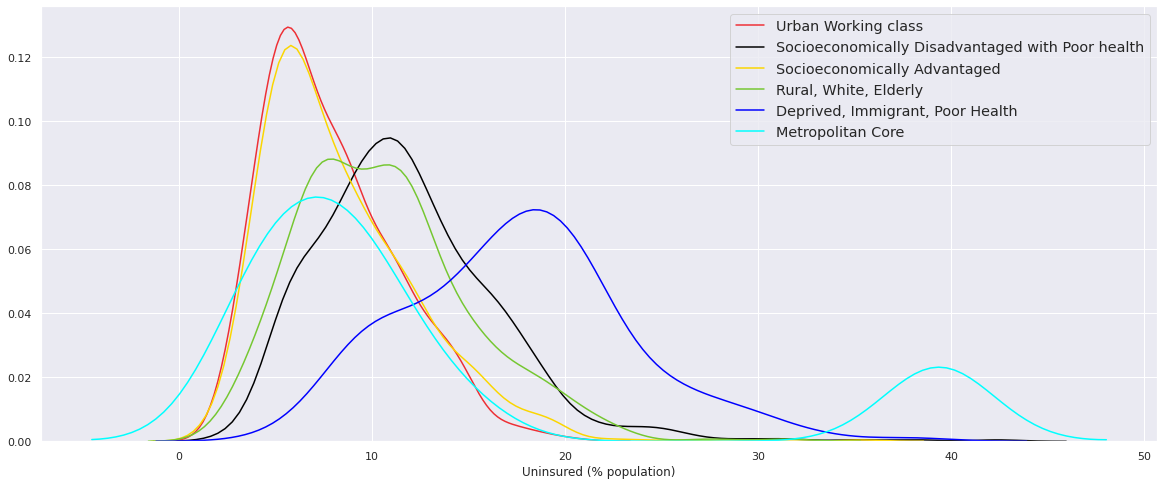
Uninsured (% population) with Typology
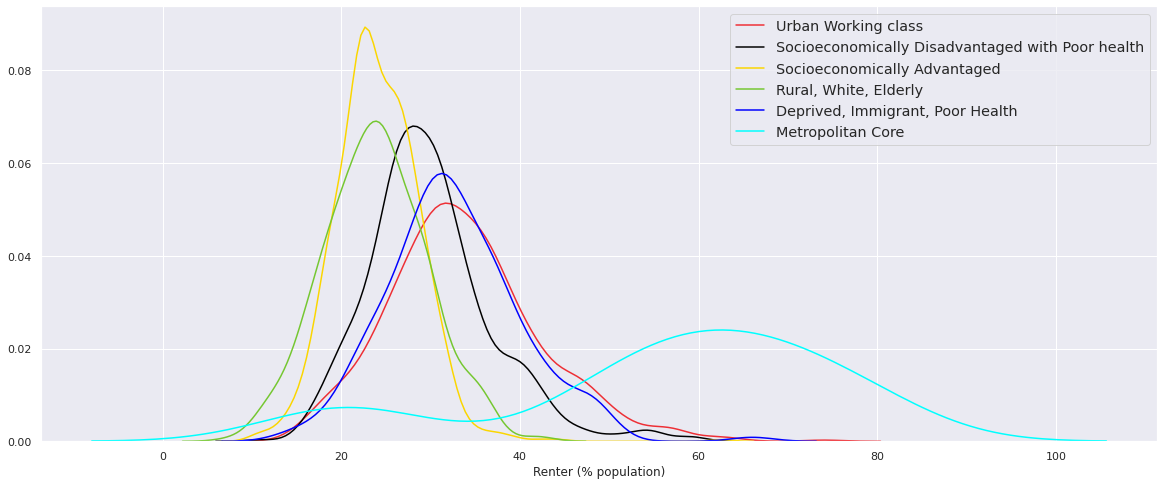
Renter (% population) with Typology
Rent burden (% population) with Typology

Crowded housing (% population) with Typology

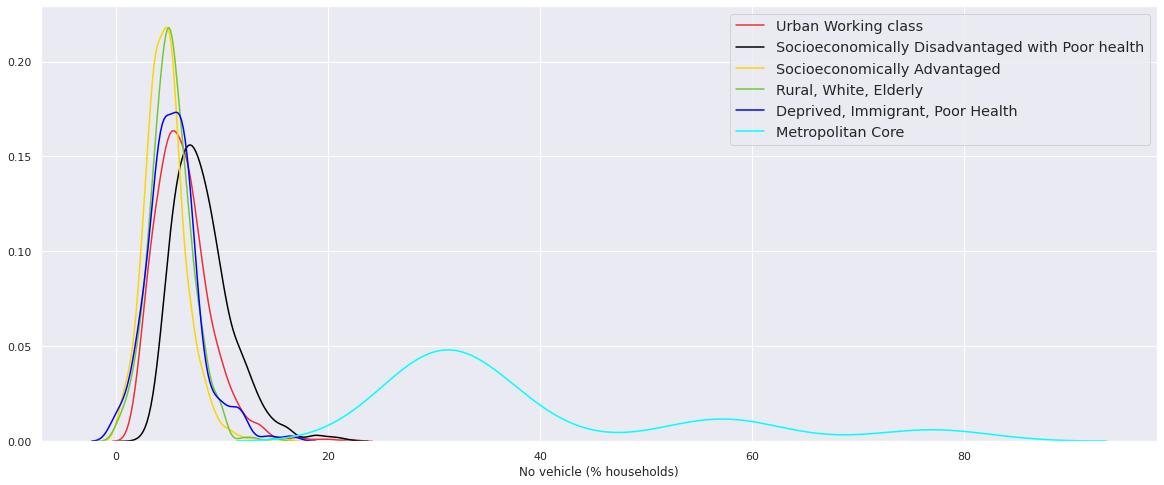
No vehicle (% households) with Typology
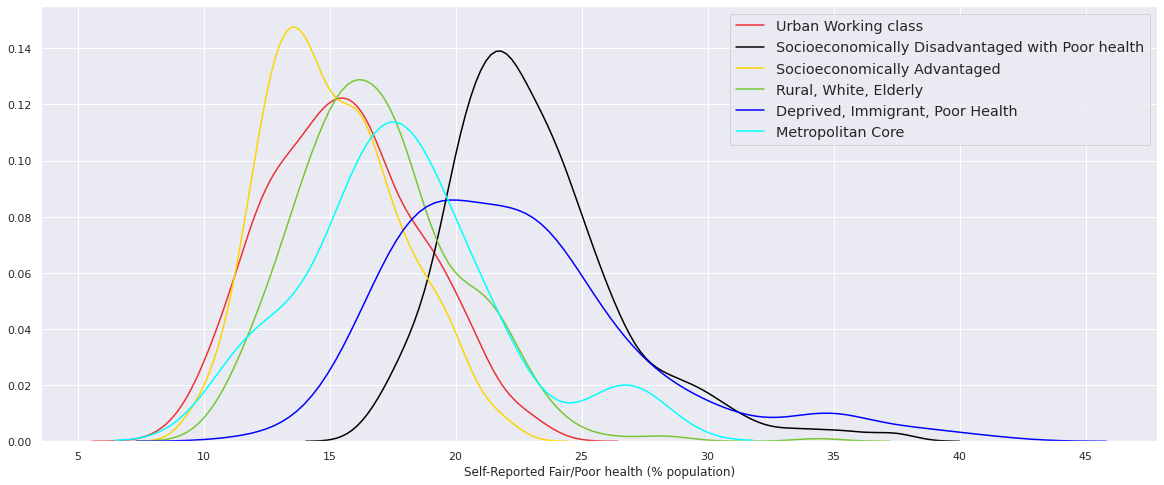
Self-Reported Fair/Poor health (% population)
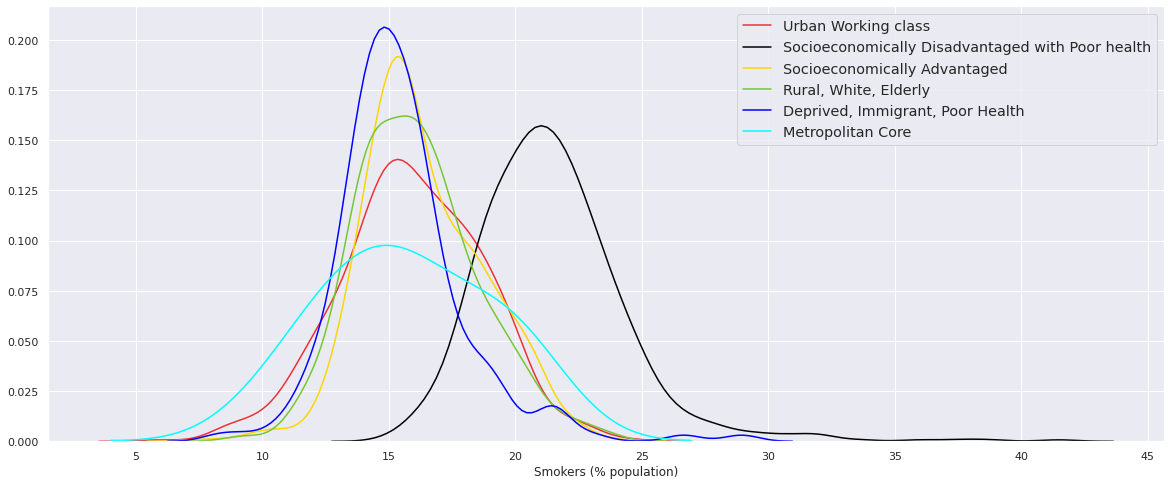
Smokers (% population)
Obese (% population)

Excessive alcohol intake (% population)

Self-reported diabetes (% population)

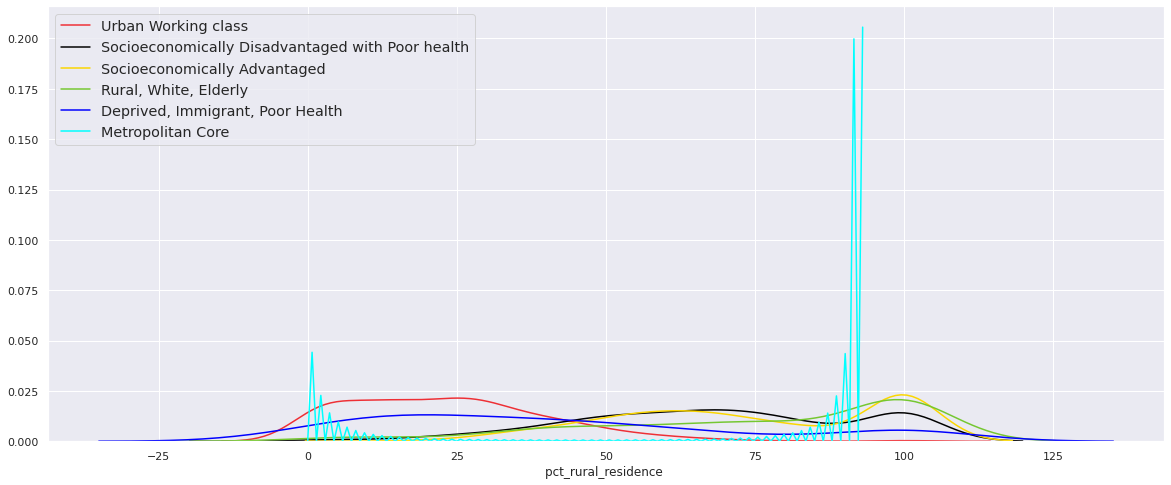
Rural residence (% population)
Net rate of migration in 2017-18
